Discount Analyst
An agent that values stocks
Discount Analyst
Published: Mon, 16 Feb 2026
Last modified: Sat, 21 Mar 2026

Abstract
In this blog, I explain how I built an AI agent to help value stocks as part of my regular stock-picking workflow. This agent uses web search tools to research a company before picking appropriate values for a DCF analysis of the stock. I use the results of the DCF analyses of the stocks to decide which stocks to buy. You can find the code for this blog here.
Introduction
I have been investing in equity index funds for years, but last year, I decided to to start learning about investing in individual stocks out of curiosity (and a little bit of greed).
It started with reading books about investing, but I quickly started wanting to do it myself. Soon after I started doing it myself, I quickly did not want to do it myself. It involves a lot of research for each company you consider. So I decided to automate the process with AI.
I also reasoned that, given my inexperience in investing, an AI would be far better than me. I use AI a lot for coding, so I am keenly aware that AI sometimes makes mistakes that take an experienced practitioner to catch. Unfortunately, I am not an experienced practitioner of investing, so I will not be able to catch mistakes that the AI makes. I plan to use AI to try to identify errors for me, but I will inevitably miss some of them. Again, I still expect it to be far better than me.
To help automate my stock-picking process, I built an agent that researches and values a given stock for me. I use this to find out which of the stocks that I am considering buying are undervalued.
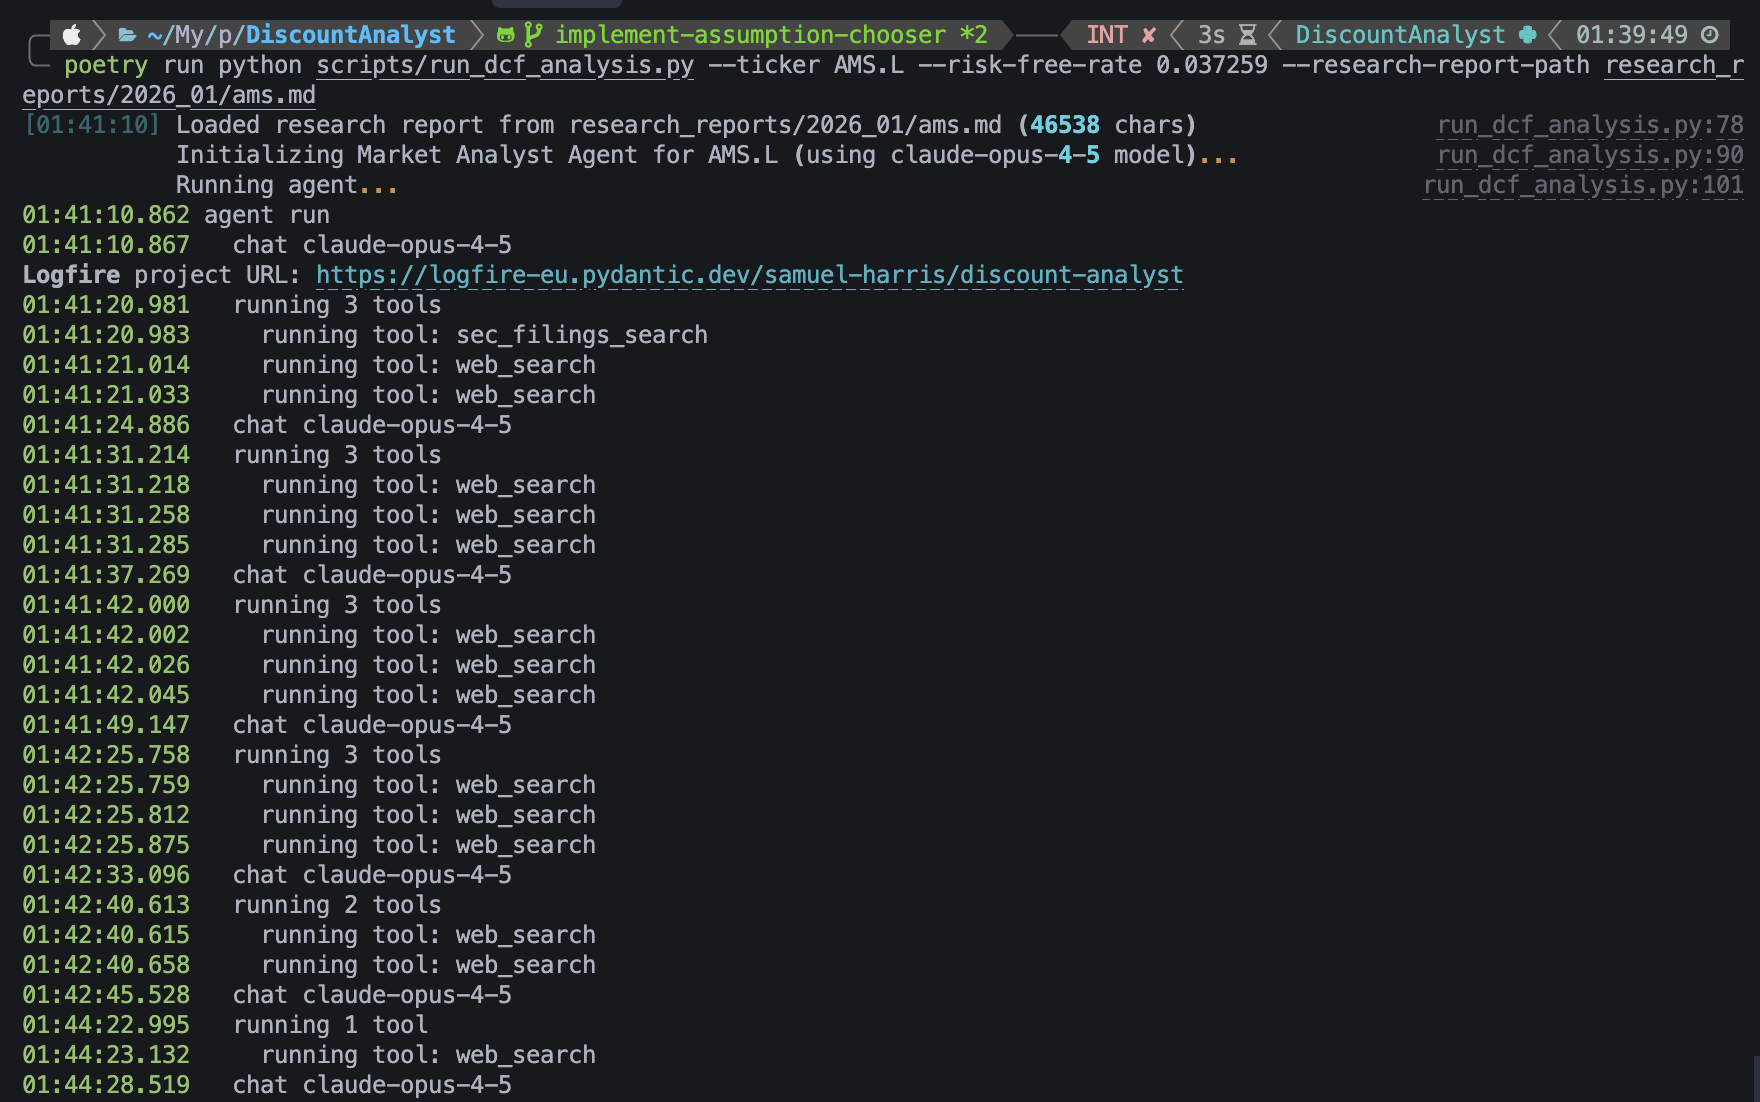
The agent researching the stock.
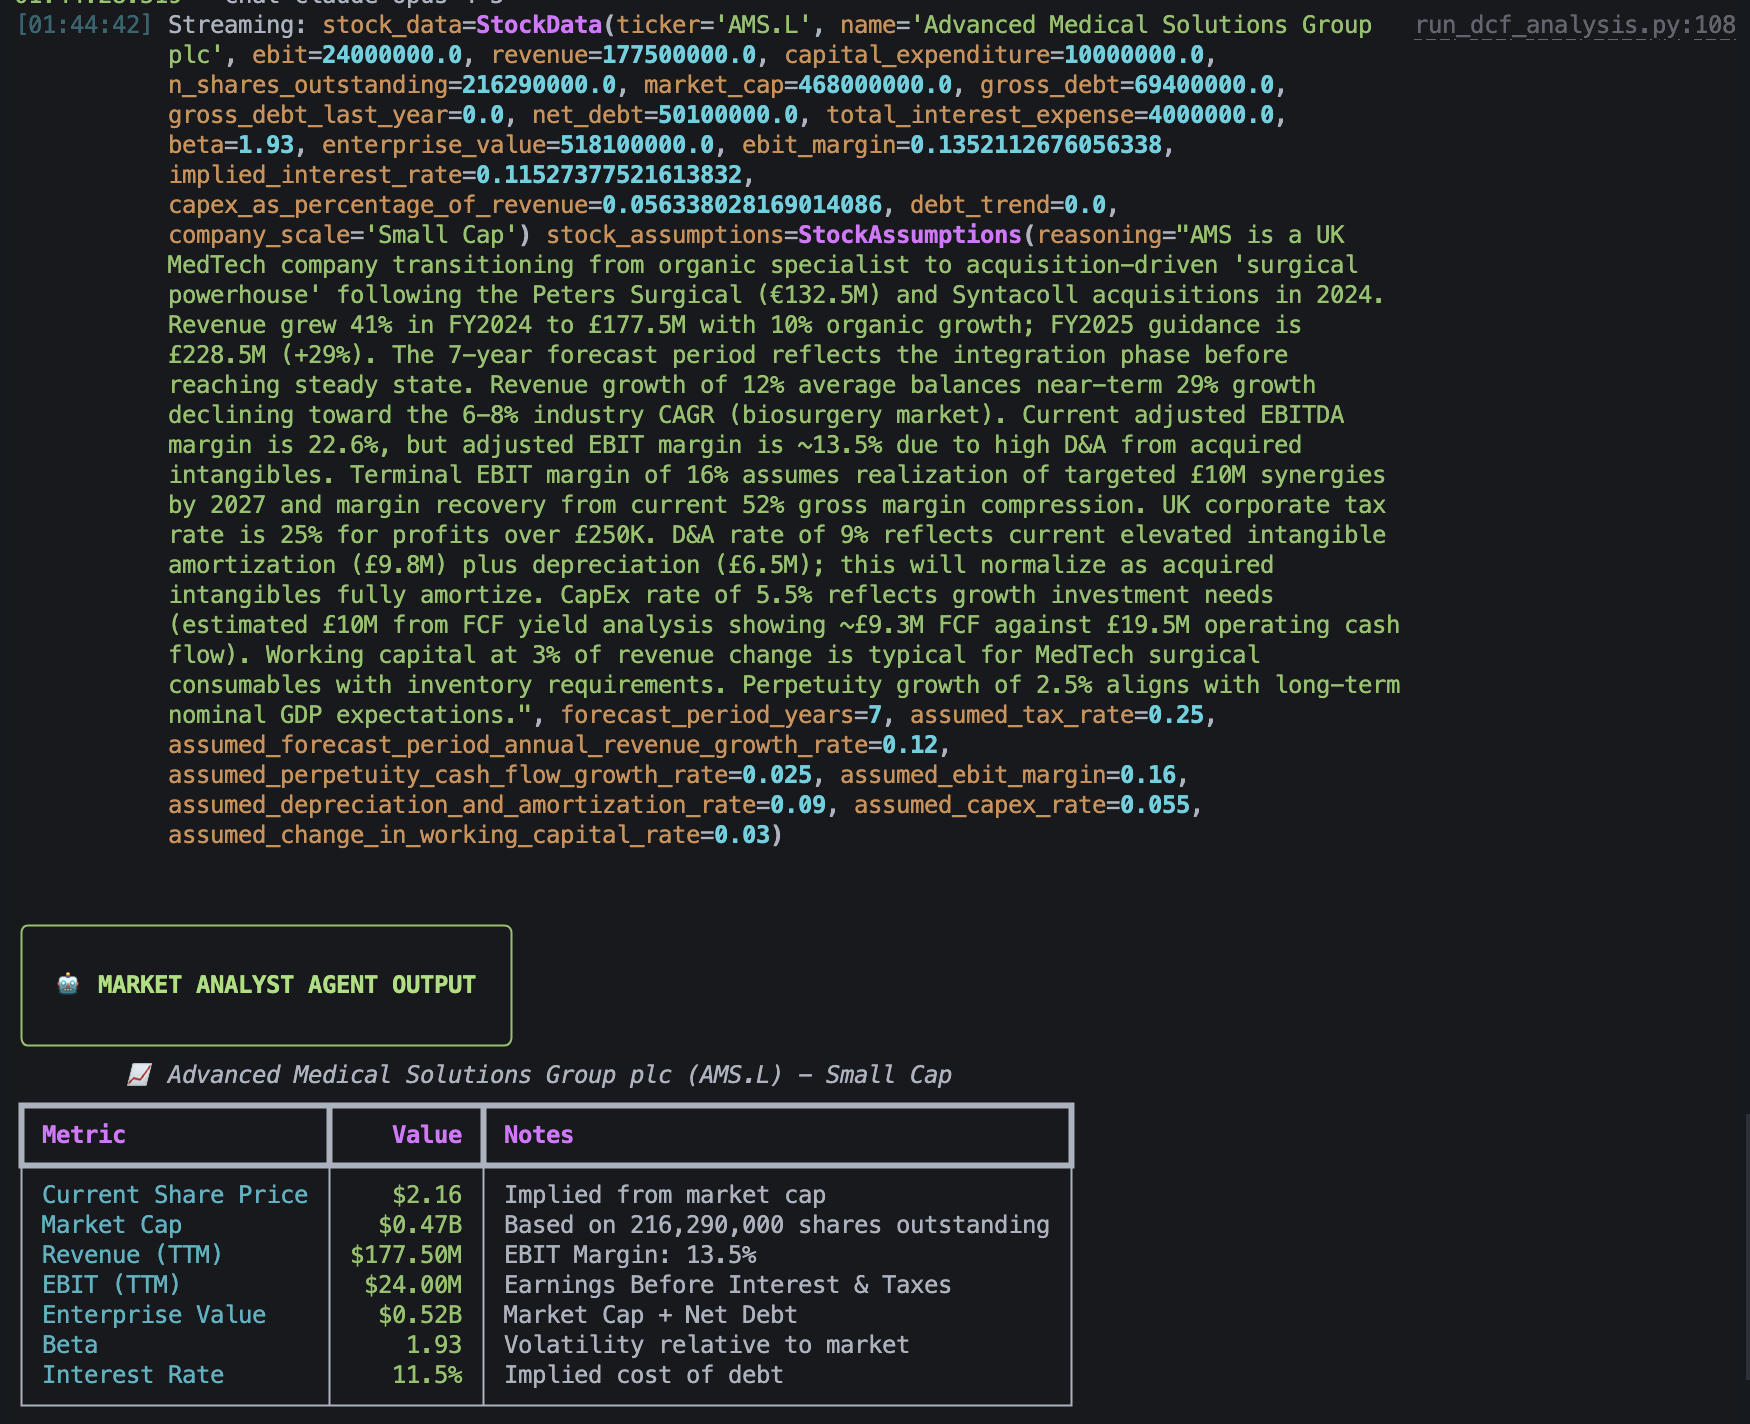
The values the agent chose for its financial model.
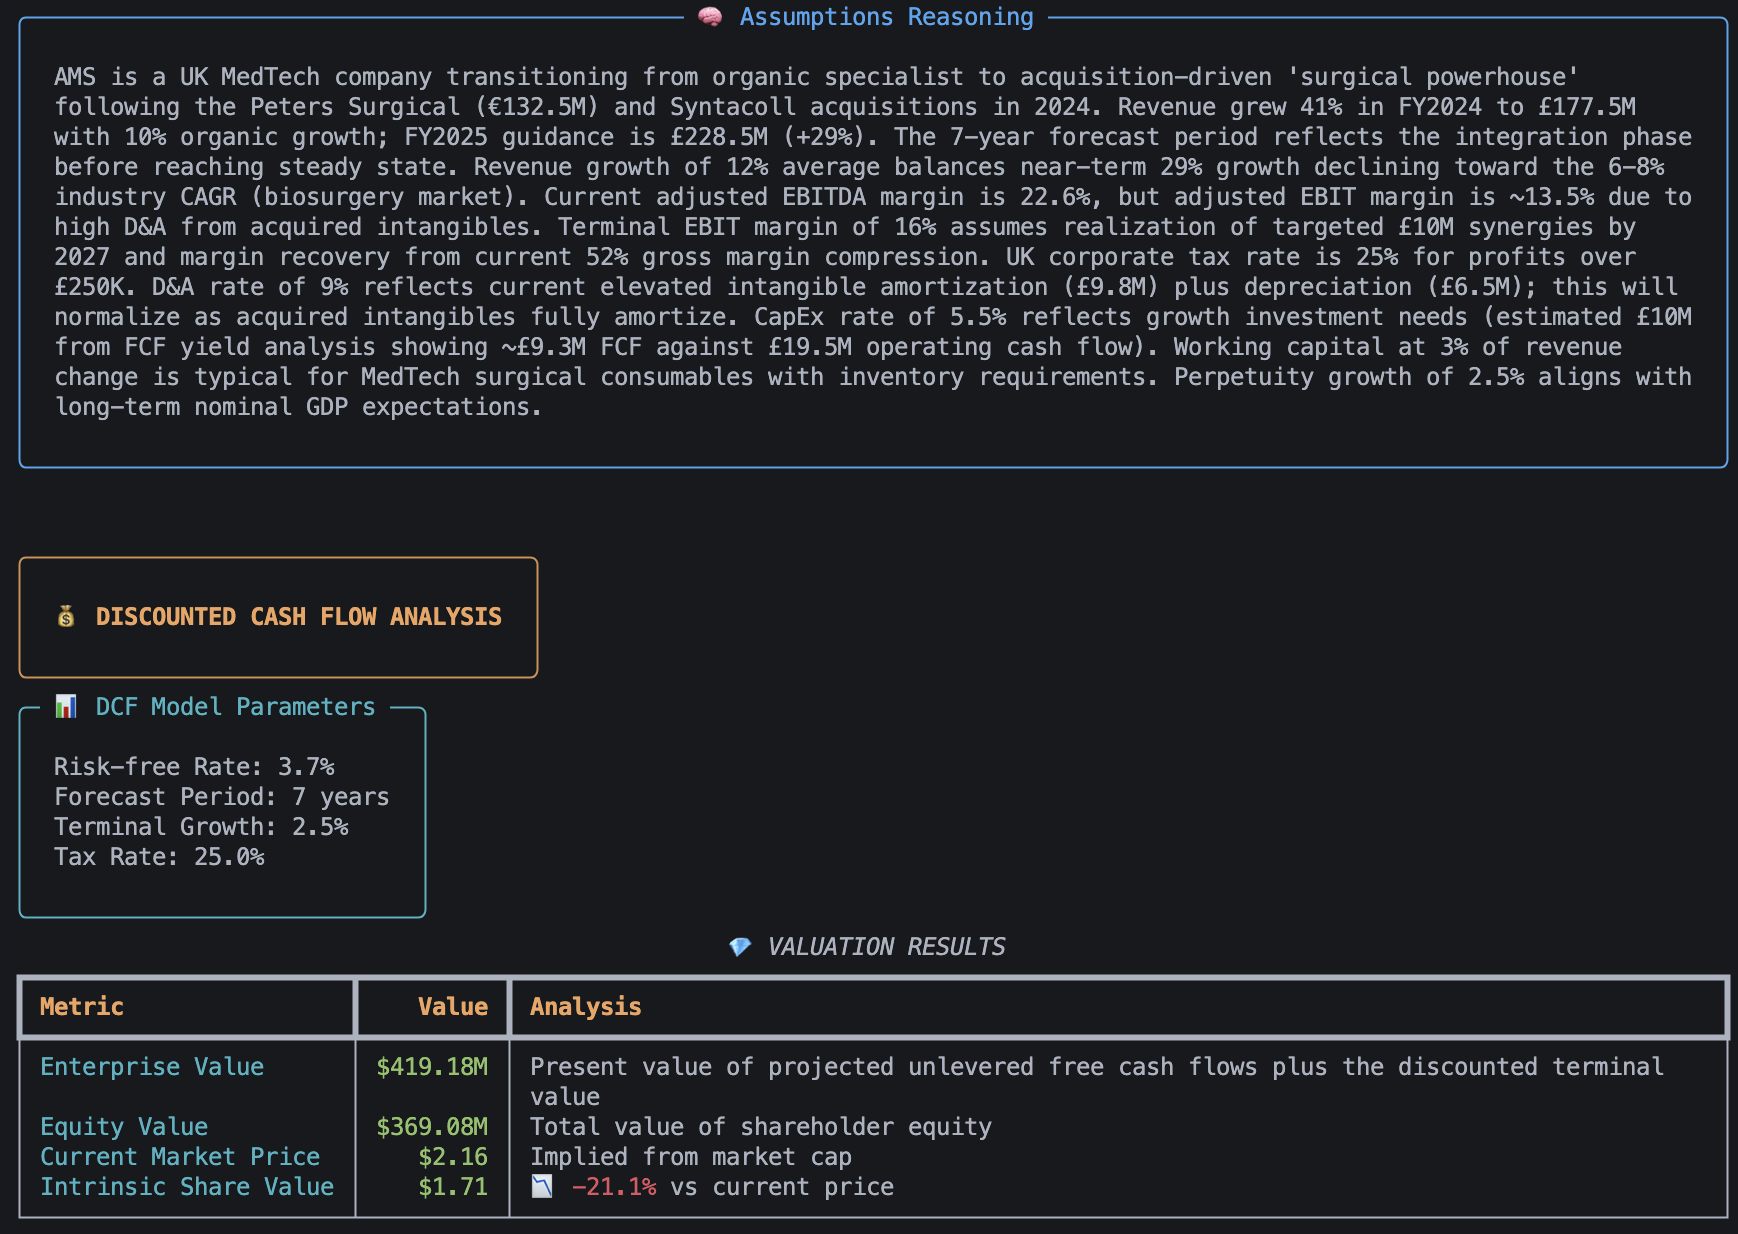
The agent's valuation of the company.
What is DCF Analysis?
Discounted cash flow (DCF) is a financial model that calculates what an investment is worth today by projecting its future cash flows and adjusting them back to present value using a chosen discount rate.
How this works is not particularly important to this blog. What's important is that it's a method for valuing a business based on current characteristics of the business, such as the revenue and net debt, and predictions made about the business, such as the annual revenue growth rate.
The Tech Stack
So what technologies did I use to build this? Python was an obvious choice for the language because I know it very well and there is plenty of support on Python for developing AI applications. But what else?
Pydantic AI
Calling LLM provider APIs and providing tools to agentic AIs is common problem, so I decided to use a framework for this rather than reinventing the wheel. I find the abstractions in LangChain to be unnecessarily complicated, so I decided to use Pydantic AI, a thinner, far less opinionated agent framework made by the team behind Pydantic. I have not used Pydantic AI extensively enough to understand its limitations, but I like it so far as it gives me a provider-agnostic way to define agents.
Logfire
An unexpected boon of using Pydantic AI was that it natively supports Pydantic Logfire, Pydantic's LLM observability platform. Pydantic Logfire is a really useful LLM ovservability platform that lets you easily measure and record AI request traces, token usafe, cost, execution time, etc. With a generous free tier that lets you record 10 million logs/spans/metrics each month, I highly recommend trying this platform.

The two lines of code needed to enable extensive LLM observability.
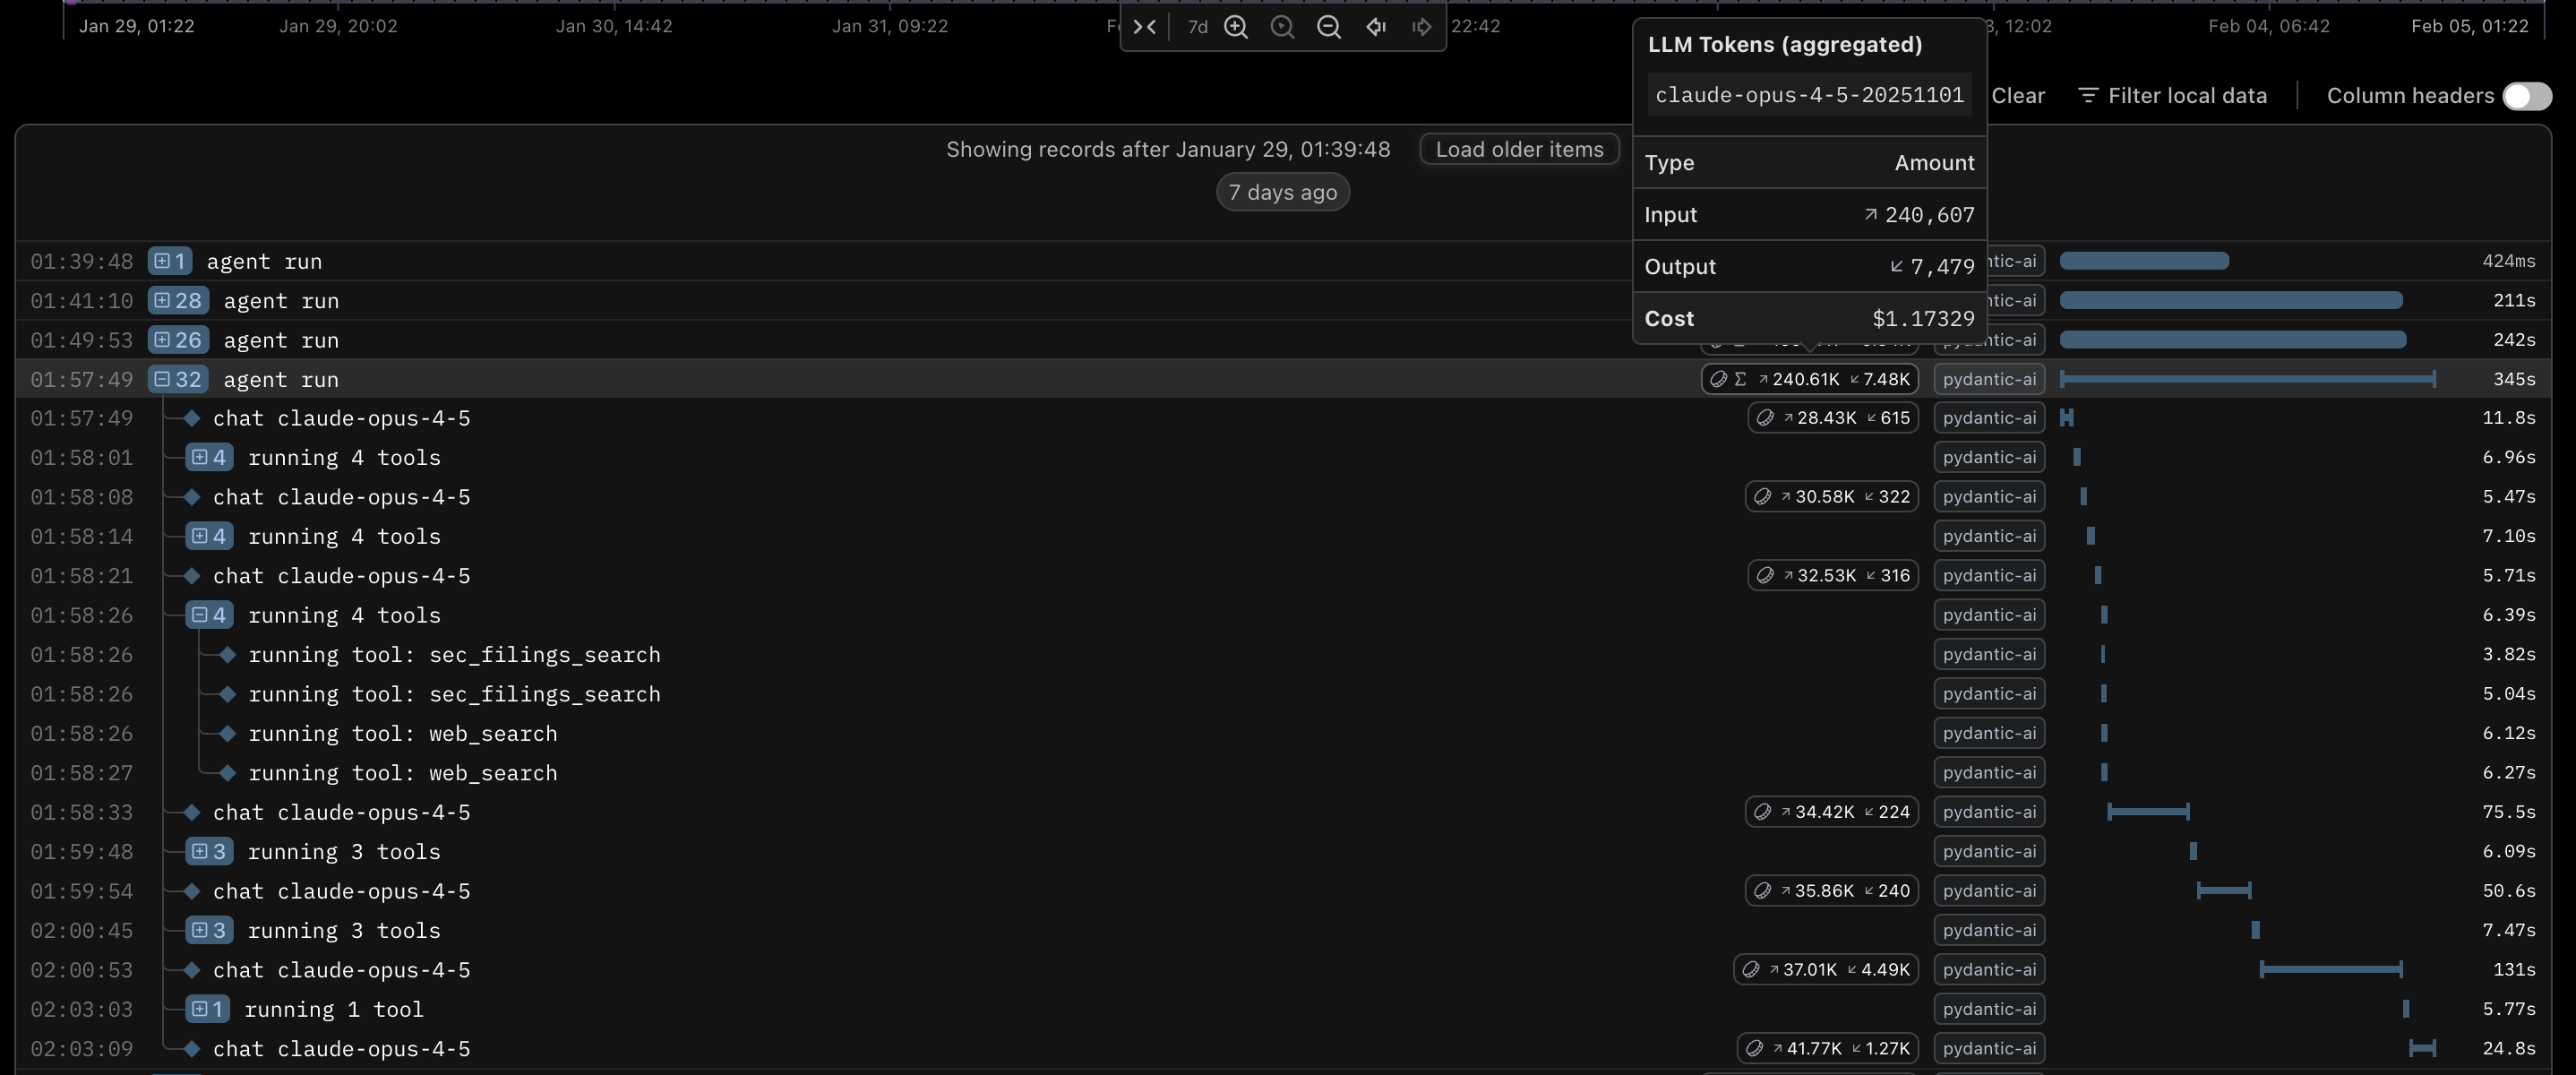
A trace shown in Pydantic Logfire.
Anthropic
The model choice was a very quick one for me. I work as an AI engineer and frequently test out different models. While I was developing this, Anthropic's Claude Opus 4.5 was the most intelligent model, so I decided to use this. For testing, I decided to use Anthropic's Claude Haiku 4.5, as it was cheaper.
Opus 4.6 wasn't available while I was developing this, but it came out while I was writing this blog. At the time of writing, it has only recently come out, so I have not tested it extensively, but it does not seem to be significantly better than Opus 4.5. Although I do think Opus 4.6 is the best model available.
Perplexity
The next piece of the puzzle was Perplexity. Perplexity offers an API that searches the internet for a query and summarises the result from several different sources. While any LLM API worth its salt can do web searches, Perplexity's web search offers SEC filings searches. The United States Securities and Exchange Commission (SEC) requires all companies with publicly traded securities to regularly file financial reports with them, making SEC filings a fundamental data source when valuing US stocks.
By using Perplexity for all web searches, I also get the benefit of delegating research and exploration to a subagent, keeping the main orchestration agent's context cleaner. This reduces context rot in the main agent.
Earlier, I mentioned that every LLM provider worth its salt offers web search. Anthropic is no exception. I wanted to get this working quickly, but I still wanted SEC filings. The SEC offers an API, and I could have set up a subagent to do the web and SEC filings search using an Anthropic model, but I decided that it wouldn't be worth the effort for my MVP.
Implementation
Data Fetcher
To begin, I decided to implement a module for fetching data. I decided to use yfinance, an open-source Python library that uses Yahoo Finance's public APIs to fetch financial data. I chose this because Yahoo Finance is a great source of free financial data.
Unfortunately, the Yahoo Finance APIs are terrible, so data is missing or formatted differently for many stocks, so I had to add a lot of logic to handle missing data (e.g., by fetching the data from other keys in the returned dictionary and by trying to calculate the missing data using given data). I also had to group together financial statements dated within 90 days of each other to fill in gaps in the data as I needed. I chose a 90 day window because I feared that statements more than 90 days apart in date would not be usable together. Even 90 days is a lot, but there were many stocks where I couldn't find all the data I needed with all of the data dated to the same date.
Letting the Agent Fetch the Data
Due to the shortcomings of the Yahoo Finance APIs, I decided to allow the AI to do the searching. I considered using a paid stock data API, but I decided that letting the AI do the searching would be a more robust solution, as the cheap consumer-grade stock data APIs¹ seemed to have limitations on which companies within the US and UK (the two places I mainly invest in) they offered and which countries they offered. By allowing the AI to simply search the web, I didn't need to worry about this.
¹ I would have a heart attack if I had to pay for a Bloomberg terminal.
DCF Analysis Model
My implementation of the DCF analysis model was a simple implementation of the formula described earlier. It just requires the following input:
class StockData(BaseModel):
    ticker: str = Field(
        description="The stock ticker symbol (e.g., 'AAPL', 'MSFT', 'TSLA'). Used to uniquely identify the company in financial markets."
    )
    name: str = Field(
        description="The full legal or common name of the company (e.g., 'Apple Inc.', 'Microsoft Corporation'). This is the official company name as reported in regulatory filings."
    )

    # Income Statement Metrics
    ebit: float = Field(
        description="Earnings Before Interest and Taxes (EBIT) in currency units (USD). Also known as Operating Income. This is the company's profit from operations before financing costs and taxes. Formula: Revenue - Cost of Goods Sold - Operating Expenses. Used to calculate operating cash flows in DCF analysis."
    )
    revenue: float = Field(
        description="Total revenue (top-line sales) in currency units (USD). This is the company's total sales from all business operations for the most recent fiscal period. Also called 'net sales' or 'turnover'. Used as the baseline for calculating margin ratios and projecting future growth."
    )

    # Cash Flow Statement Metrics
    capital_expenditure: float = Field(
        description="Capital Expenditures (CapEx) in currency units (USD). Cash spent on acquiring or maintaining physical assets like property, plants, and equipment. Found in the Cash Flow from Investing Activities section. Used to calculate Free Cash Flow (FCF = Operating Cash Flow - CapEx). Positive value represents cash outflow."
    )

    # Market Data
    n_shares_outstanding: float = Field(
        description="Number of shares outstanding (fully diluted). Total number of shares currently held by all shareholders, including restricted shares and those held by insiders. Used to calculate per-share metrics and to convert equity value to per-share price."
    )
    market_cap: float = Field(
        description="Market Capitalization (Equity Value) in currency units (USD). Current market value of all outstanding shares. Formula: Share Price × Shares Outstanding. Represents what the market believes the company's equity is worth. Used as a sanity check against DCF-derived equity value."
    )

    # Balance Sheet - Debt Metrics
    gross_debt: float = Field(
        description="Total Gross Debt (current period) in currency units (USD). Sum of all short-term and long-term debt obligations, including bonds, loans, and credit facilities. Found on the liabilities side of the balance sheet. Does NOT subtract cash. Used to calculate Enterprise Value (EV = Market Cap + Net Debt)."
    )
    gross_debt_last_year: float = Field(
        description="Total Gross Debt from the prior fiscal year in currency units (USD). Used to calculate year-over-year change in debt levels and to assess debt repayment or issuance trends. Helps validate interest expense calculations."
    )
    net_debt: float = Field(
        description="Net Debt in currency units (USD). Formula: Gross Debt - Cash and Cash Equivalents. Can be negative if the company has more cash than debt (net cash position). Used in Enterprise Value calculation: EV = Market Cap + Net Debt. Represents the debt that would remain if all cash were used to pay down obligations."
    )

    # Income Statement - Financing Costs
    total_interest_expense: float = Field(
        description="Total Interest Expense in currency units (USD). Cash paid or accrued for interest on debt obligations during the period. Found in the Income Statement, typically below EBIT. Used to calculate the effective interest rate on debt: Interest Rate = Interest Expense / Average Debt. Important for WACC calculation and understanding the cost of debt financing."
    )

    # Risk Metric
    beta: float = Field(
        description="Beta coefficient (dimensionless). Measures the stock's volatility relative to the overall market (typically S&P 500). Beta = 1.0 means the stock moves in line with the market. Beta > 1.0 means the stock is more volatile than the market (higher risk). Beta < 1.0 means the stock is less volatile than the market (lower risk). Used in CAPM to calculate Cost of Equity: Re = Rf + Beta × (Rm - Rf). Typically measured over 2-5 years of historical data."
    )

    @computed_field
    @property
    def enterprise_value(self) -> float:
        """
        Calculated Enterprise Value (EV) in currency units.
        Formula: Market Cap + Net Debt
        Represents the total value of the company's operations.
        """

        return self.market_cap + self.net_debt

    @computed_field
    @property
    def ebit_margin(self) -> float:
        """
        Calculated EBIT Margin as a decimal (e.g., 0.15 for 15%).
        Formula: EBIT / Revenue
        Measures operating profitability.
        """

        if self.revenue == 0:
            return 0.0
        return self.ebit / self.revenue

    @computed_field
    @property
    def implied_interest_rate(self) -> float:
        """
        Calculated implied interest rate on debt as a decimal (e.g., 0.045 for 4.5%).
        Formula: Total Interest Expense / Average Gross Debt
        Represents the company's effective cost of debt.
        """
        avg_debt = (self.gross_debt + self.gross_debt_last_year) / 2
        if avg_debt == 0:
            return 0.0
        return self.total_interest_expense / avg_debt

    @computed_field
    @property
    def capex_as_percentage_of_revenue(self) -> float:
        """
        Calculated CapEx as a percentage of revenue, expressed as a decimal (e.g., 0.06 for 6%).
        Formula: Capital Expenditure / Revenue
        Measures capital intensity and investment requirements relative to sales.
        Used as a baseline for the 'assumed_capex_rate' in DCF projections.
        Higher values indicate capital-intensive businesses (manufacturing, infrastructure).
        Lower values indicate asset-light businesses (software, services).
        """

        if self.revenue == 0:
            return 0.0
        return self.capital_expenditure / self.revenue

    @computed_field
    @property
    def debt_trend(self) -> float:
        """
        Calculated debt trend as a percentage (e.g., -0.075 for -7.5%).
        Formula: (Gross Debt - Gross Debt Last Year) / Gross Debt Last Year
        Represents the change in debt levels over the period. Positive = adding debt, Negative = paying down debt.
        """

        if self.gross_debt_last_year == 0:
            return 0.0
        return (self.gross_debt - self.gross_debt_last_year) / self.gross_debt_last_year

    @computed_field
    @property
    def company_scale(self) -> str:
        """
        Calculated company scale based on market cap.
        Large cap (typically mature), Mid-large cap (growth or mature), Mid cap (often growth stage), Small cap (high growth potential), or Micro cap (very high growth potential).
        """
        if self.market_cap > 10_000_000_000:
            return "Large Cap"
        elif self.market_cap > 2_000_000_000:
            return "Mid Cap"
        elif self.market_cap > 300_000_000:
            return "Small Cap"
        else:
            return "Micro Cap"


class StockAssumptions(BaseModel):
    reasoning: str = Field(
        description="The reasoning behind the assumptions made. This should explain the logic for the chosen values, citing any relevant data points or trends observed in the company's financials or industry."
    )

    forecast_period_years: int = Field(
        description="The number of years for the explicit forecast period before terminal value calculation. Typically 5 years for mature companies, 7-8 years for growing/transitioning companies, and 10 years for high-growth companies far from steady state."
    )
    assumed_tax_rate: float = Field(
        description="The assumed corporate tax rate as a decimal (e.g., 0.21 for 21%). Should reflect the lower of statutory rate or company's historical effective tax rate."
    )
    assumed_forecast_period_annual_revenue_growth_rate: float = Field(
        description="The assumed average annual revenue growth rate during the forecast period as a decimal (e.g., 0.15 for 15%). For companies with declining growth, this represents the geometric average across all forecast years. Must be greater than perpetuity growth rate."
    )
    assumed_perpetuity_cash_flow_growth_rate: float = Field(
        description="The assumed long-term sustainable growth rate of cash flows in perpetuity as a decimal (e.g., 0.025 for 2.5%). Should not exceed nominal GDP growth; typically 2.0-3.0%. Must be less than forecast period growth rate."
    )
    assumed_ebit_margin: float = Field(
        description="The assumed normalized/terminal EBIT margin as a decimal (e.g., 0.18 for 18%). Represents the expected steady-state operating margin at the end of the forecast period, typically benchmarked against peer group medians."
    )
    assumed_depreciation_and_amortization_rate: float = Field(
        description="The assumed depreciation and amortization rate as a percentage of revenue, expressed as a decimal (e.g., 0.05 for 5%). Based on historical median D&A/Revenue ratio."
    )
    assumed_capex_rate: float = Field(
        description="The assumed capital expenditure rate as a percentage of revenue, expressed as a decimal (e.g., 0.06 for 6%). Should reflect maintenance capex plus growth capex needs. For growth companies, typically exceeds D&A rate; for mature companies, approximately equals D&A rate."
    )
    assumed_change_in_working_capital_rate: float = Field(
        description="The assumed change in working capital as a percentage of revenue change, expressed as a decimal (e.g., 0.02 for 2%). Represents cash consumed by working capital as the business grows. Can be negative for companies with negative working capital models."
    )


class MarketAnalystOutput(BaseModel):
    stock_data: StockData
    stock_assumptions: StockAssumptions
I included complete descriptions of each field and split the fields into stock_data, the real data that should be fetched from the internet, and stock_assumptions, the predicted fields that the agent must decide on. I did this to ensure that the agent understands what to put into each field and how to find the information for each field.
To help the agent decide on appropriate assumptions about the stock for the DCF analysis, I first run a deep research task using ChatGPT or Gemini to find out information about the company and pass the generated research report to my agent. This helps give the agent a lot of context on the current state of the company and its position in the market.
The Agent
The Agent's workflow
I typically find that modern frontier LLMs perform tasks best when they are given full autonomy. Cursor's blog on how they built Bugbot, my favourite tool for catching bugs in code reviews, shows that I am not the only one in the industry who thinks this.
AI still benefits from some guidance, so in its system prompt, I asked it to follow the following steps that a human might follow when valuing a stock themselves:
- Gather Current Financials (StockData)
- Gather Historical & Contextual Data
- Determine Assumptions (StockAssumptions)
- Consistency Checks (verify work)
I threw a few span traces into Gemini and made it review what the agent had done based on the system prompt, and it seemed to have followed my instructions well.
Tools
To be able to find the stock data and decide on the stock assumptions, the agent needed access to tools to access information about the company, other companies related to it, and the current state of the market. I cannot programmatically predict all of the information that will be needed before the agent, so it is imperative that the agent can autonomously find information.
As mentioned earlier, at first, obtained the stock data from Yahoo Finance using the yfinance library, but I found the Yahoo Finance APIs to be far too flaky to rely on. Instead, I decided to make the agent find this information itself using the tools I provided it.
I ended up providing the agent with the following tools:
- web_search
- sec_filings_search
Both of these use the Perplexity API. The difference is that web_search searches the regular internet, whereas sec_filings_search restricts the search to SEC filings only. SEC filings are financial documents that US companies publish, so they are incredibly useful for valuing stocks on the US stock market. The Perplexity API takes a query from my agent, does the search, and answers the query using natural language, so it effectively acts like a subagent that answers queries on behalf of the main agent, allowing the main agent to keep a lean context.
I had originally turned on citations and implemented a fetch_web_page tool. The idea was that the AI could check the sources of cited information to look for more information. For the first few runs, it never actually used the tool.
@agent.tool_plain(docstring_format="google", require_parameter_descriptions=True)
async def fetch_web_page(url: str) -> str:
    """Fetch the content of a specific web page.

    Use this tool to get the full text content of a specific URL that you have found via web search
    or other means. This is useful for detailed reading of articles, reports, or specific data pages.

    Args:
        url: The URL of the web page to fetch.

    Returns:
        The text content of the web page.
    """
    async with httpx.AsyncClient() as client:
        response = await client.get(url, follow_redirects=True)
        response.raise_for_status()
        return md(response.text)
I quickly disabled the tool after its first use, as it ended up taking almost half an hour to complete using close to a million input tokens. Normal runs only took a few minutes and used between 70 and 150 thousand input tokens. This single run cost me $5.22 (USD) when a typical run costs me between $0.30 and $0.70, so it was certainly not something I wanted to risk happening again.
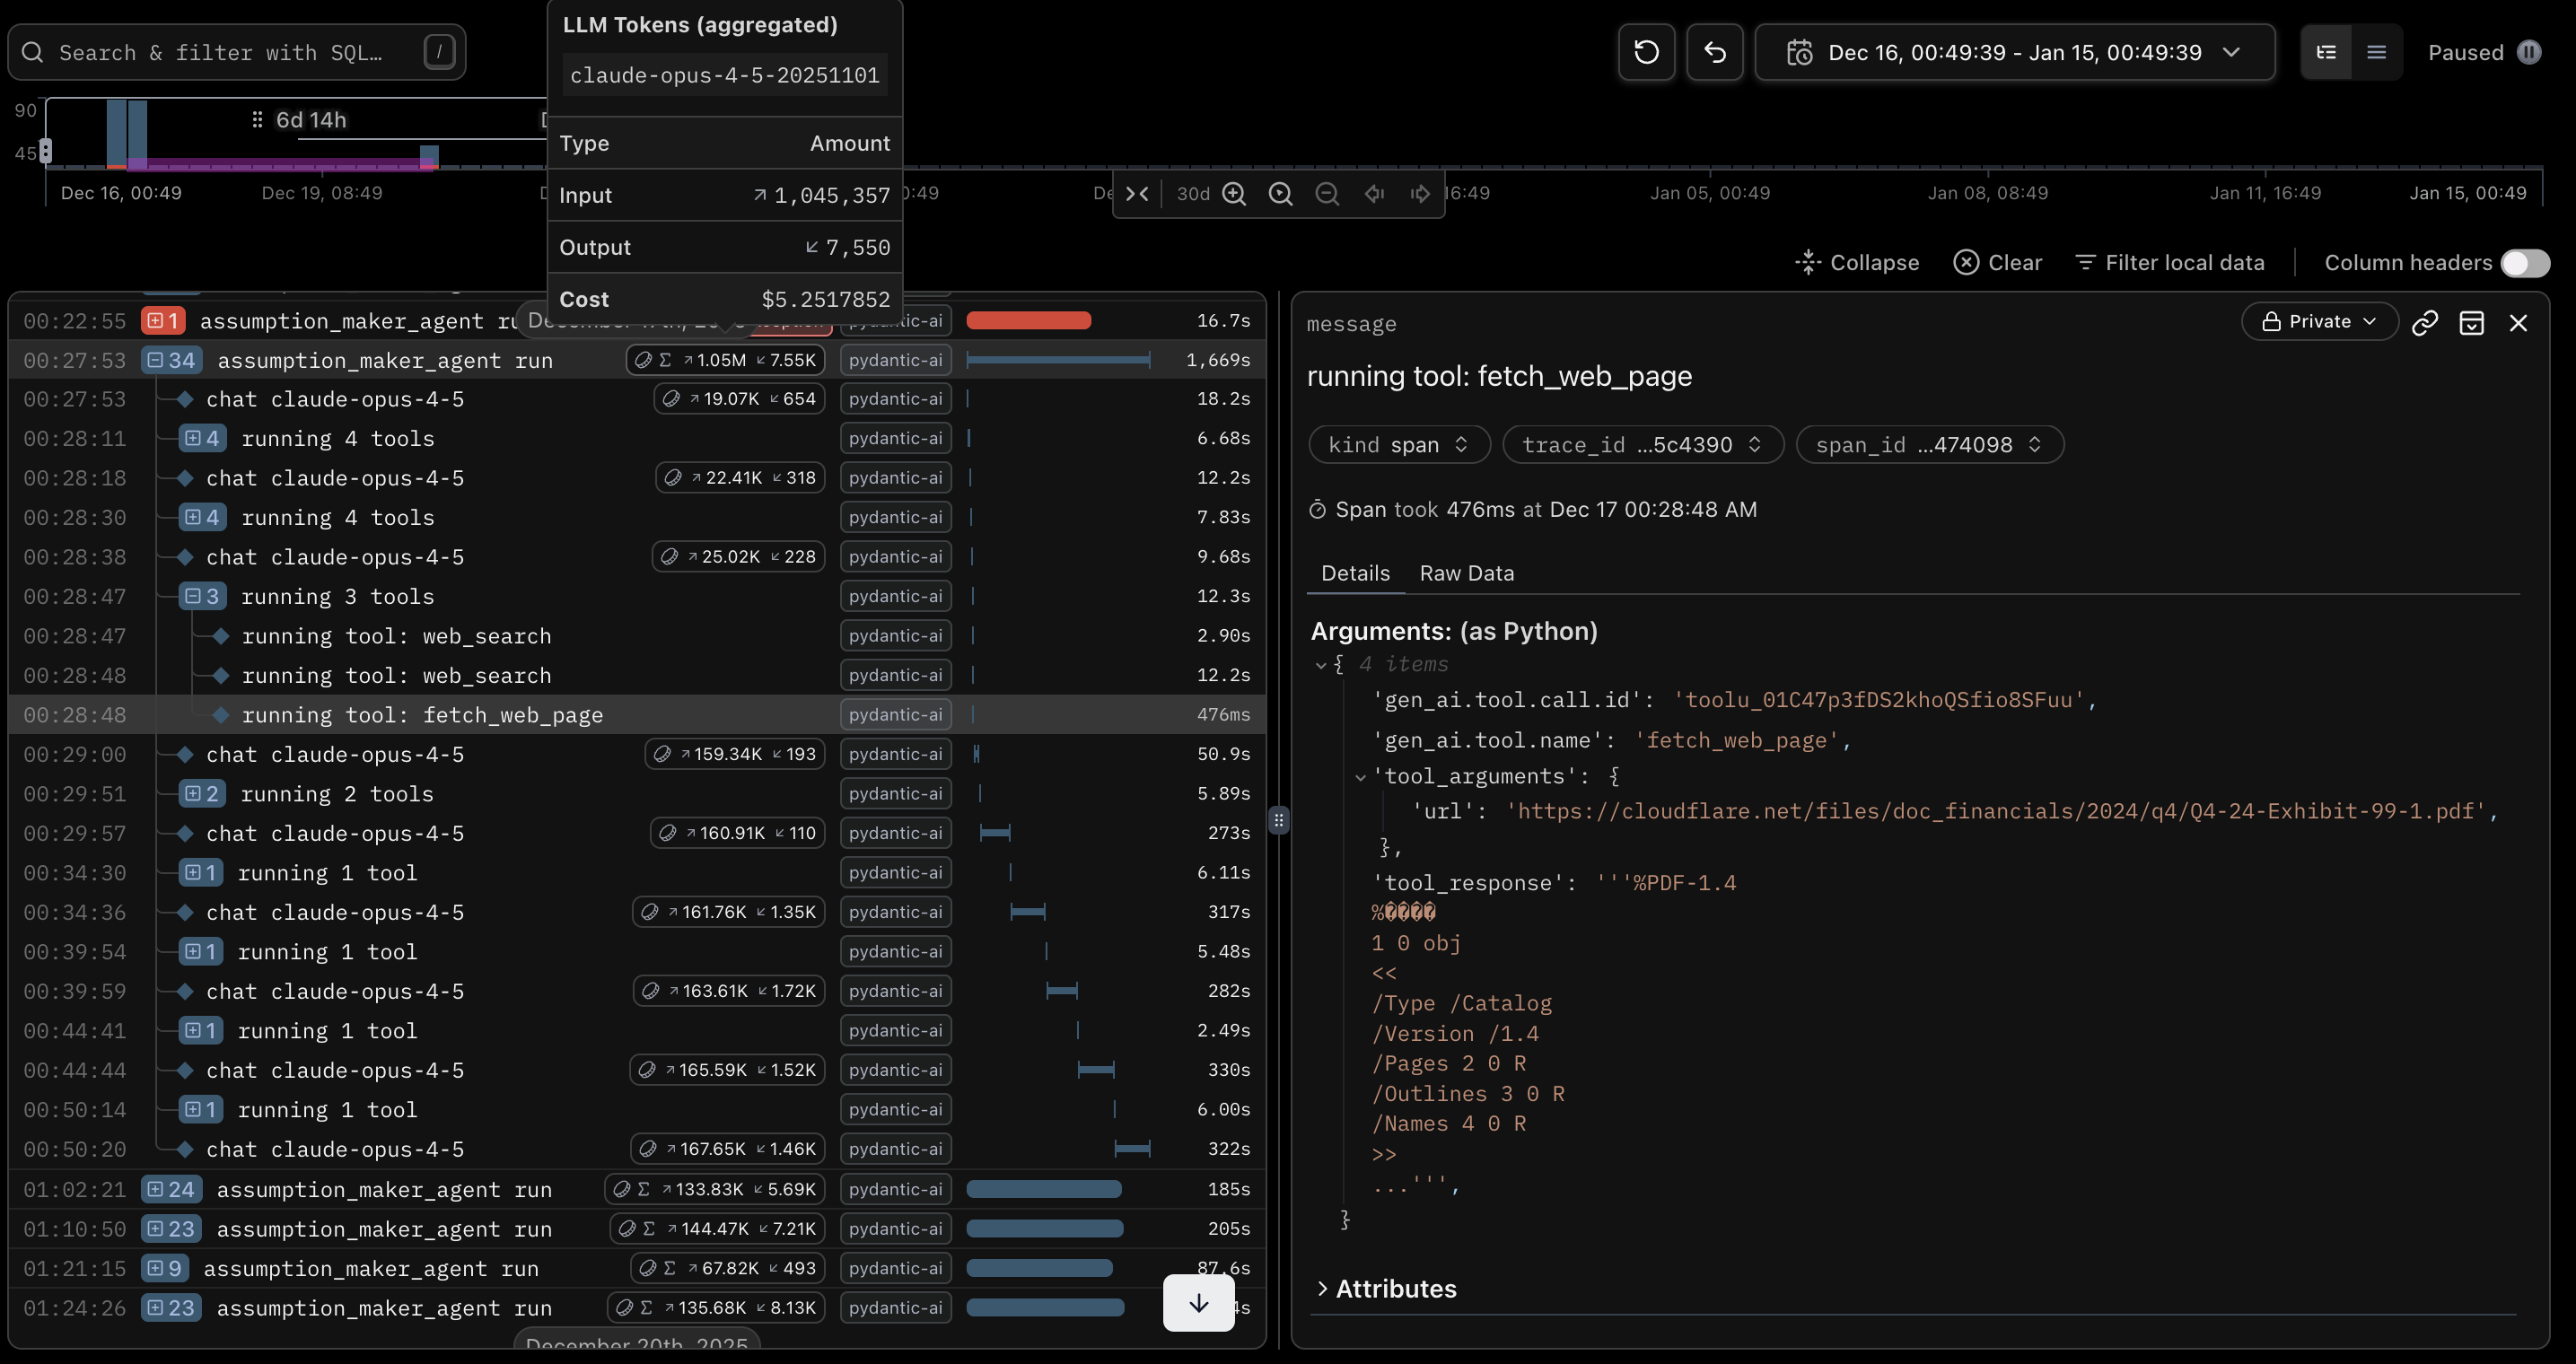
What happens when you don't control your agent.
The Final Workflow
My full stock-picking workflow.
Conclusion
Even when completing the agentic part of the DiscountAnalyst, I was regularly using the DCF analysis code to value stocks. Now that the agentic part has been created, I regularly use it to value stocks and inform my stock purchases. It's too early to say whether the agent accurately valued the stocks, but I guess I'll see with time. Overall, I consider this to be quite a successful project.
Julian King wrote a poignant blog on AI and the Gell-Mann amnesia effect that is very relevant here. When an AI writes code, I can point out the flaws in its work and correct it. When my AI analyses stocks, I cannot point out a single mistake beyond incredibly obvious mistakes, so I naturally default to trusting it completely. While it will certainly do a much better job than I will, I do need to remember to take its recommendations with a pinch of salt.